

Latest essay: Openings that Work with Style
Latest short story: The Gosling
Now what follows is something else. Something different. Not for everyone.
Methodology: Investing as a Writer
Starting at the beginning of January, 2026, I began keeping score between my investments (according to the rules of my “method”) and the S&P 500. I keep that score updated on my Investing as a Writer page and record what stocks I own and what I’m buying and selling daily.
Here, I want to discuss my current methodology. That “method” evolves as I go; the record-keeping is meant as a challenge to myself to do better. Until today, until this, nothing has gone out via email, and I’ve not talked about what I’m posting. Today, for my birthday, I thought it was time to share with anyone who’s into this kind of thing.
Disclaimer: The information provided in this material is for educational and informational purposes only and should not be construed as financial advice. I am not a licensed financial advisor, and nothing contained herein constitutes a recommendation to buy, sell, or hold any security or investment. Investing in stocks involves risk, including the potential loss of principal. Before making any investment decisions, you should conduct your own research and consult with a qualified financial professional who can assess your individual circumstances, financial situation, and investment objectives.
The Sniff Test:
I began experimenting with a new idea just before Thanksgiving. It’s a “sniff test” to determine what stocks to explore as possible buy candidates. It doesn’t matter what your sniff test is, but you want it to have some correlation with a stock’s success. It’s not proof that a stock will succeed, just a guide that this is where you want to start looking.
You need to understand what your sniff test tells you. Mine shows me where there is unmet desire for a stock at the end of the day, at or above its closing price. That information points me to stocks that could have a good day or two. It doesn’t tell me anything about the underlying health of the company or what the stock will do in the middle or long term. As my sniff test is short-term focused, I need back-up data that is also short-term focused.
Back-up Data:
For a bit, I was recording each stock’s Average Broker Rating and how its value related to its current price. I quit when I realized that while those are important for long-term investments, they couldn’t guide my understanding of what would be doing well over a span of days. It was just busy work.
Now, if I were looking for a stock that would do well in the short-term but which I could then hold for a prolonged period, that information would be relevant.
Because I’m doing this every night, I want each step to take as little time as possible. My sniff test isn’t tracked on stock screeners, and for a month, I was visiting each stock’s page to get the information I needed. Eventually, I realized I could quickly scan a watch list for my sniff-test data. For the back-up data, I just go to Google.
For that long-term information, I could just ask for the Average Broker Rating. Value has proven trickier.
Price-to-Book (P/B) ratio—comparing a stock's market price to its accounting "book value"—is a bit lacking. Investors often prefer more comprehensive "fair value" metrics that account for future growth and cash generation. Consider one of these alternatives:
Intrinsic Value (via Discounted Cash Flow): This estimates the current worth of a business based on projections of how much cash it will generate in the future. It is widely considered the most “theoretically sound” method because it values a company as a living entity rather than just a collection of assets.
Enterprise Value (EV): Unlike market capitalization, EV provides a “takeover price” by including the company’s total debt and subtracting its cash. This is often used in the EV/EBITDA ratio to compare companies with different debt levels.
PEG Ratio (Price/Earnings-to-Growth): For high-growth stocks like ARM, the standard P/E ratio can be misleadingly high. The PEG ratio adjusts the P/E by the company’s expected growth rate; a PEG below 1.0 is generally considered undervalued.
Free Cash Flow Yield: This measures how much cash a company generates per share relative to its stock price. Many investors prefer this over “earnings” because cash is harder to manipulate with accounting tricks than “net income”.
For a growth-oriented company like ARM Holdings, analysts often use a Forward P/E (based on next year’s estimated earnings) or Price-to-Sales (P/S), as these better reflect its role in the expanding AI and semiconductor markets.
On occasion, I will tell Google what I’ve been asking for and why and ask it for better alternatives. I began with a complicated formula, but Google suggested using P/V (adjusted), instead. Then one day, it acted like it didn’t know what I meant by P/V (adjusted) and what would ever provoke me to try something so idiotic. It gave me other options.
Technical Analysis:
Now, though, I’m focused on short-term data, and that relies on technical analysis. I like to ask the following:
On [stock symbol] stock chart, what are the current resistance and support levels, which is it currently approaching, and are we expecting a breakthrough or a reversal is more likely?
The following is an example response:
As of January 24, 2026, SanDisk Corporation (SNDK) is exhibiting extreme volatility following an explosive 105% year-to-date rally driven by AI-related NAND flash memory demand.
Current Support and Resistance Levels
Based on technical data from January 22–23, 2026:
Immediate Resistance: $502.48 - $509.50. This represents the recent all-time high set this week.
Primary Support: $463.01 - $467.56. These levels align with recent intraday lows where buyers have previously stepped in.
Secondary Support: $448.53. A break below this level is viewed by analysts as a signal for a potential trend reversal.
Target Resistance: $520.00. Analysts identify this as the next major psychological and technical extension level if momentum continues.
Current Approach and Market Outlook
The stock is currently approaching a critical support test after pulling back from its $509.50 peak to close at $473.83 on Friday, January 23.
Likelihood of Reversal (Short-term): High. Technical indicators strongly suggest a short-term pullback or “reversal” of the immediate uptrend. The Relative Strength Index (RSI) reached extreme overbought levels of 91–92 this week, signaling exhaustion. A 5–10% correction toward the $448–$450 support zone is widely expected before any further sustained growth.
Likelihood of Breakthrough (Mid-term): Moderate to High. Despite the immediate overbought warning, the medium-term outlook remains bullish due to strong AI fundamentals. Analysts maintain “Strong Buy” ratings, projecting a breakthrough toward $520–$550 later in Q1 2026, provided support at $460 holds.
Key Event to Watch: SNDK is scheduled to report earnings on January 29, 2026, which is expected to be a major catalyst for either a decisive breakout or a deeper reversal.
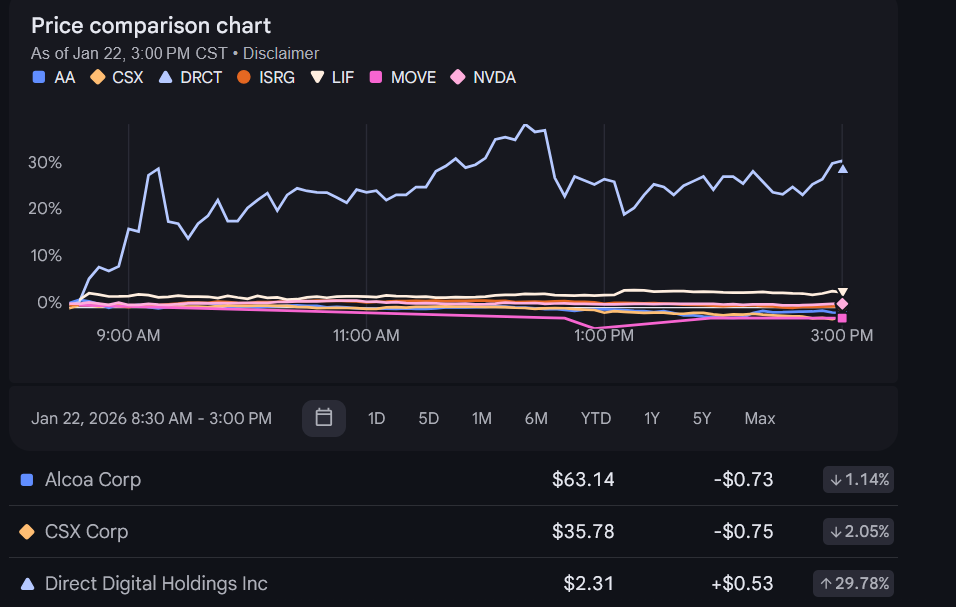
You can make the process easier and faster but that comes with greater risk. I did very well for a few days presenting Google with my stock possibilities in groups of five and just asking which were the most bullish. I’d ask again, comparing winners with winners, and then I asked this to determine if it was time to get into that stock:
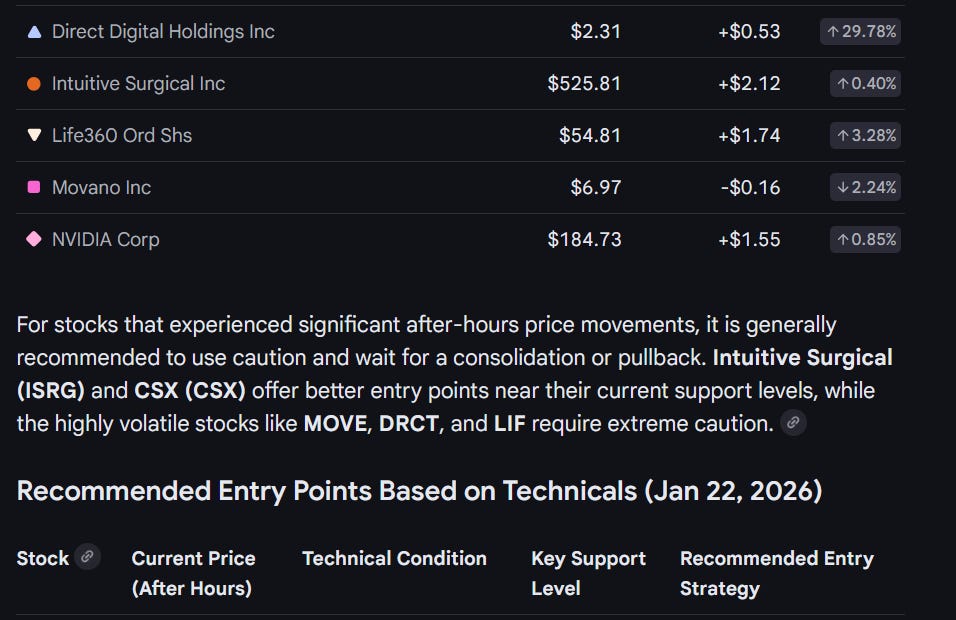
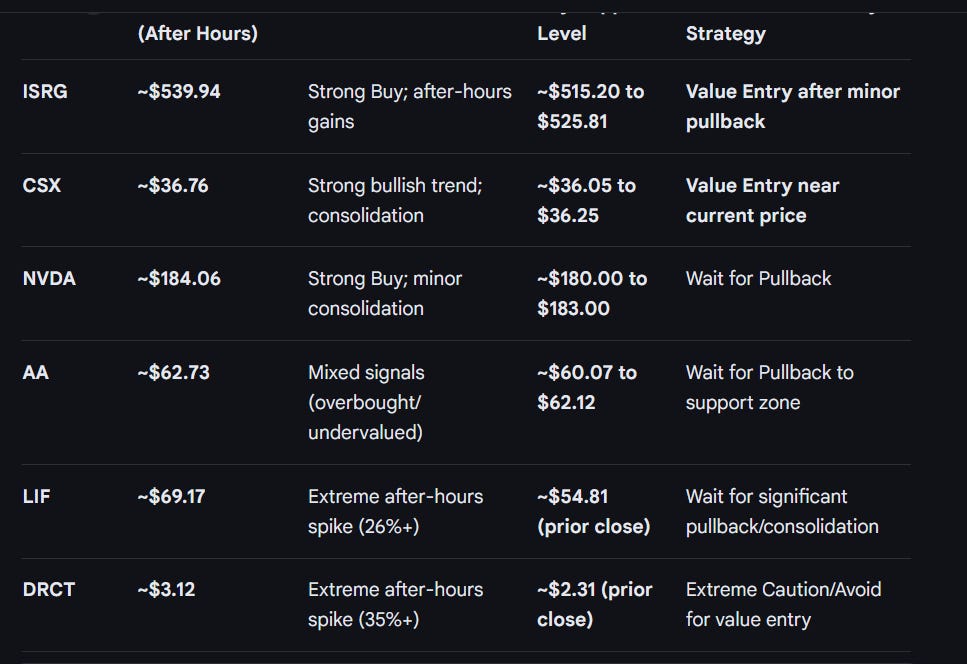
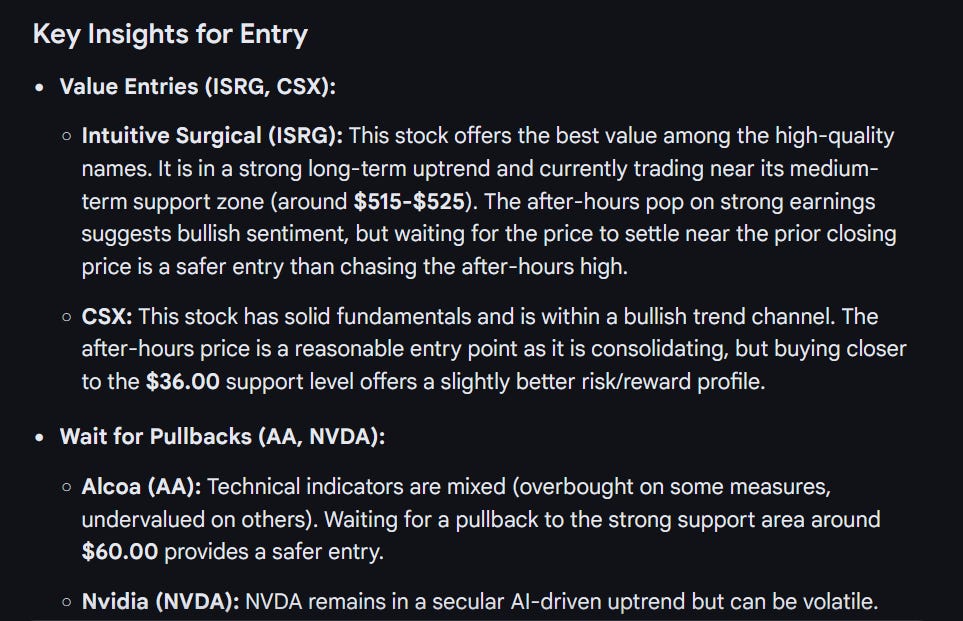
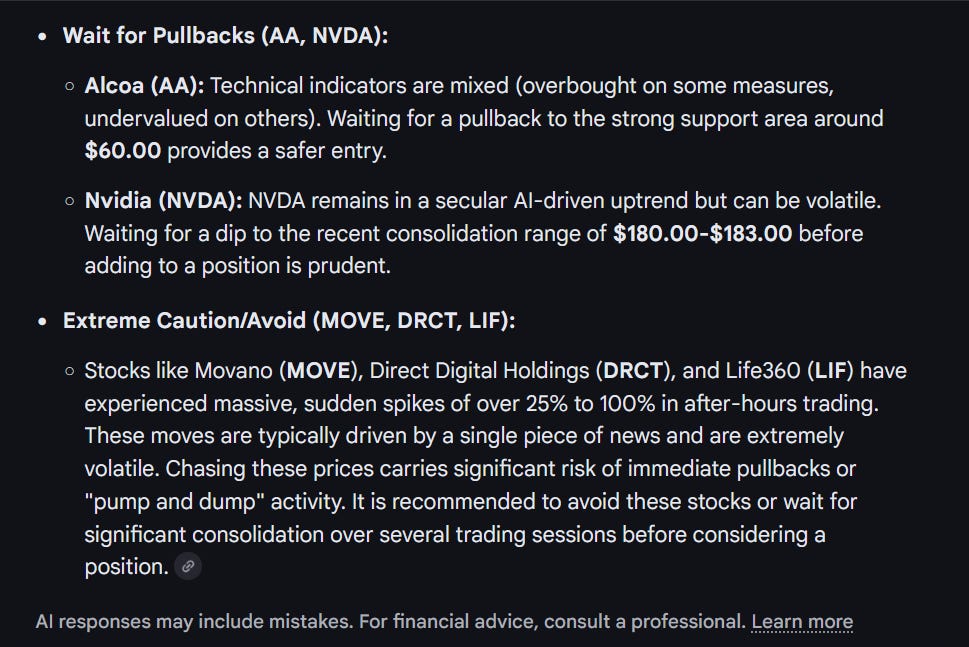
What is a good entry point for these stocks: ISRG AA CSX MOVE DRCT LIF NVDA
This is an example response:
That day, I chose the following as my potential buys:
ADBE
HOOD
HAL
AAPL
INTU
AMZN
GOOG
ISRG
CSX
As you can see, ISRG and CSX were on that list, but I chose not to buy any of the others from the list.
You’ll notice that my trades are conservative. I’m hesitant to venture below $10 a share and I still focus largely on stocks with a strong buy rating. Part of the reason for the method is keep me away from riskier trades.
What I was lacking from this information was a warning of when to get out of a stock. The SNDK example gives me an idea of when to get into a stock and when to get out. By moving away from that information for a few days, I left myself open to a pullback.
A Diversified Portfolio:
Some stocks I don’t trade on a daily basis. You can see my complete diversified portfolio on my Investing as a Writer page, but it’s still a work-in-progress. In addition to gaining exposure to areas I wasn’t invested in before, the idea here is to hold certain stocks I might have traded daily before. Precious metal stocks is the example that inspired me to make the change. When I traded metal stocks like any other, I found I was hit hard when the market moved away from metals into the next big thing. By choosing a select few precious metal stocks to hold, I gain a buffer when gold is hot and stocks are hot, but I’m not slammed when gold retracts.
My intent is to set a given amount for each of the diversified investments. I’ll occasionally when it’s high and buy when it’s low to keep at that set amount. The intent to capture the increase and to buy on the dips while keeping the investment stable.
In Tune with the Market:
Because my method is short-term focused, I need to remain in tune with the market. I make my initial choices the night before, but in the morning, I search Overnight Market News. If big changes are happening, I’ll ask what stocks benefit most from the news. I might lightly buy stocks that are up and follow that up by buying more of what’s doing well in my portfolio while selling off any reversals. Ideally, I want to stay ahead, but when that’s not possible, when I get out of tune, I need to make the necessary changes quickly.
This may be a slower process for long-term investments. Currently, for my longer-term, non-method account, I subscribe to Leaderboard by Investor’s Business Daily.
Conclusion:
While we don’t want our process to take any longer than necessary, we also want to make sure we’re getting the information we need to cover all our decisions. Otherwise, there’s nothing earth-shattering about this process. I have a sniff test to produce a list of candidate stocks and then check that list against a dataset appropriate for our chosen time-frame. I keep a diversified portfolio to keep me steady when changes come, and then I act quickly when my portfolio is out-of-tune with the market.
At the time of this writing, we’re 15 days in the market’s calendar year. My method is up 8.03%, and the S&P 500 is up 1.02%. My goals are to beat the S&P and to double my account within the year. So far, I’m on track to accomplish both.
Final Notes:
You’re familiar with the confusion over when does flash fiction become a short story, become a novelette, become a novella, become a novel. Trading is similar, but to hear most people say it, a short-term trader who holds longer than a day is called a swing trader.
Maybe my short-term style falls under that category. Much of what the typical swing trader does seems very different from what I’ve described here, but as part of my ongoing process, I do want to become more precise about when I get into a stock and when I get out, but that will take time and experimentation.
Even where I have rules, I’m known to break them, but here’s some thoughts on buying and selling I’ve gathered:
Buying pre-market often means spending more. It has proven worthwhile, however, to buy one share of a modestly priced stock to watch and purchase more later that day.
The first 30 minutes of the market is chaos. I occasionally have tried to use that to my advantage, but the general rule is it’s safer to buy after the first 30 minutes.
There’s a general pattern where the market tops at 11am, dips to noon, and rebounds to 1pm (eastern time). There’s variation to that, but I have used the pattern to my advantage in the past. In general, be wary of buying near 11 or selling near noon.
Most price action happens overnight. It can be a dangerous time to buy as you can easily overpay, but between closing and open is where I’m looking to make most of my gains.
— Thaddeus Thomas
Addendum:
1/25: Today, I’ve devised a new system I’ll be testing for ranking probabilities of a short-term breakout against a short-term reversal. The high the number, the better the odds.
A 7.05 means that, beyond its current price range, there’s a 7x better chance the stock will breakout (up) than suffer a reversal (down). A 1 would mean the odds are even.
— Thaddeus Thomas